How to find the cause of a 5xx fast
A five-step routine for a burst of 500 errors: find when it started, filter to status:5xx, follow one request id, read the lines around it, then fix.
Sam 5 min read
Updated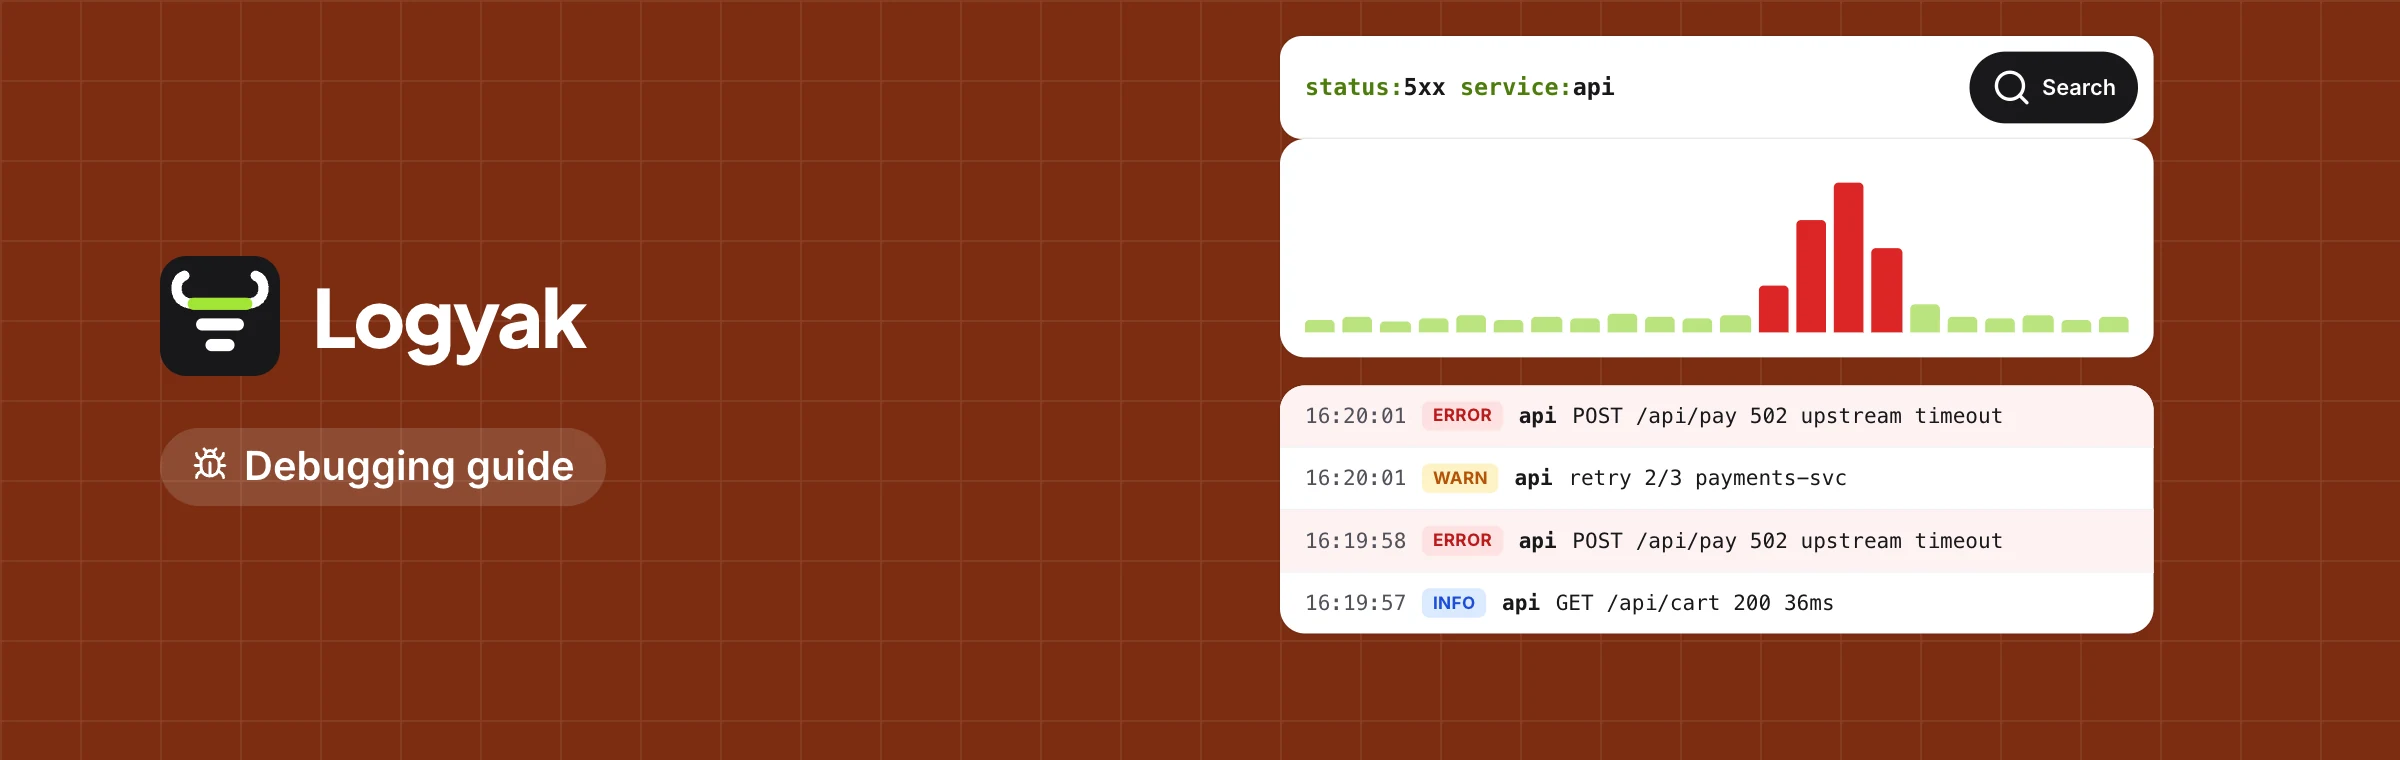
On this page
The fastest way to find the cause of a 5xx is a fixed routine rather than a hunch: look at a chart of lines by level to see when the errors started, filter to status:5xx to see which routes fail, pick one failed request and follow its request id through every service, open the lines just before the error, and only then read the stack trace. Each step narrows the search, and most 5xx bursts are explained by the third or fourth step, usually by something that changed at the moment the chart turned red.
The short version. When, then where, then one request, then its neighbours, then the fix. Do not start by reading stack traces at random: start by finding the moment it began.
Step 1: find when it started
A chart of log lines over time, split by level, answers the first question before you read a single line. On Logyak's Logs page that chart sits above the results and follows your search. Look for the edge: a red band that starts at a precise minute. That minute is your best clue. Did a deploy finish then? Did a scheduled job start? Did requests jump? A burst that starts on the dot of a deploy is a code change; one that grows with load is capacity; one that starts at 02:00 every night is a cron job.
Narrow the time range to a few minutes either side of the edge. Everything after this step is faster in a small window.
Step 2: filter to the failures
status:5xxThat one term keeps request lines with any status from 500 to 599. Now look at what they share. Add path:/api/* to see API routes only, or service:api if you have several. If every failure is on one path, the cause is in that route's code or in something only it calls. If every path fails, look lower: the database, a shared dependency, memory, or the deploy itself.
The status tells you more than it seems:
| Status | Usually means |
|---|---|
| 500 | Your code threw and nothing caught it |
| 502 | The proxy reached your app but got no valid answer: a crash, a restart, or the app not listening yet |
| 503 | Nothing healthy to send the request to, or the app is refusing work on purpose |
| 504 | Your app took too long: a slow query, a hung call to another service |
A 504 points you at duration:>10000; a 502 points you at restarts and at the lines a crashing process printed just before it died.
Step 3: follow one request
Pick one failed request and copy its request id. Then search for it alone:
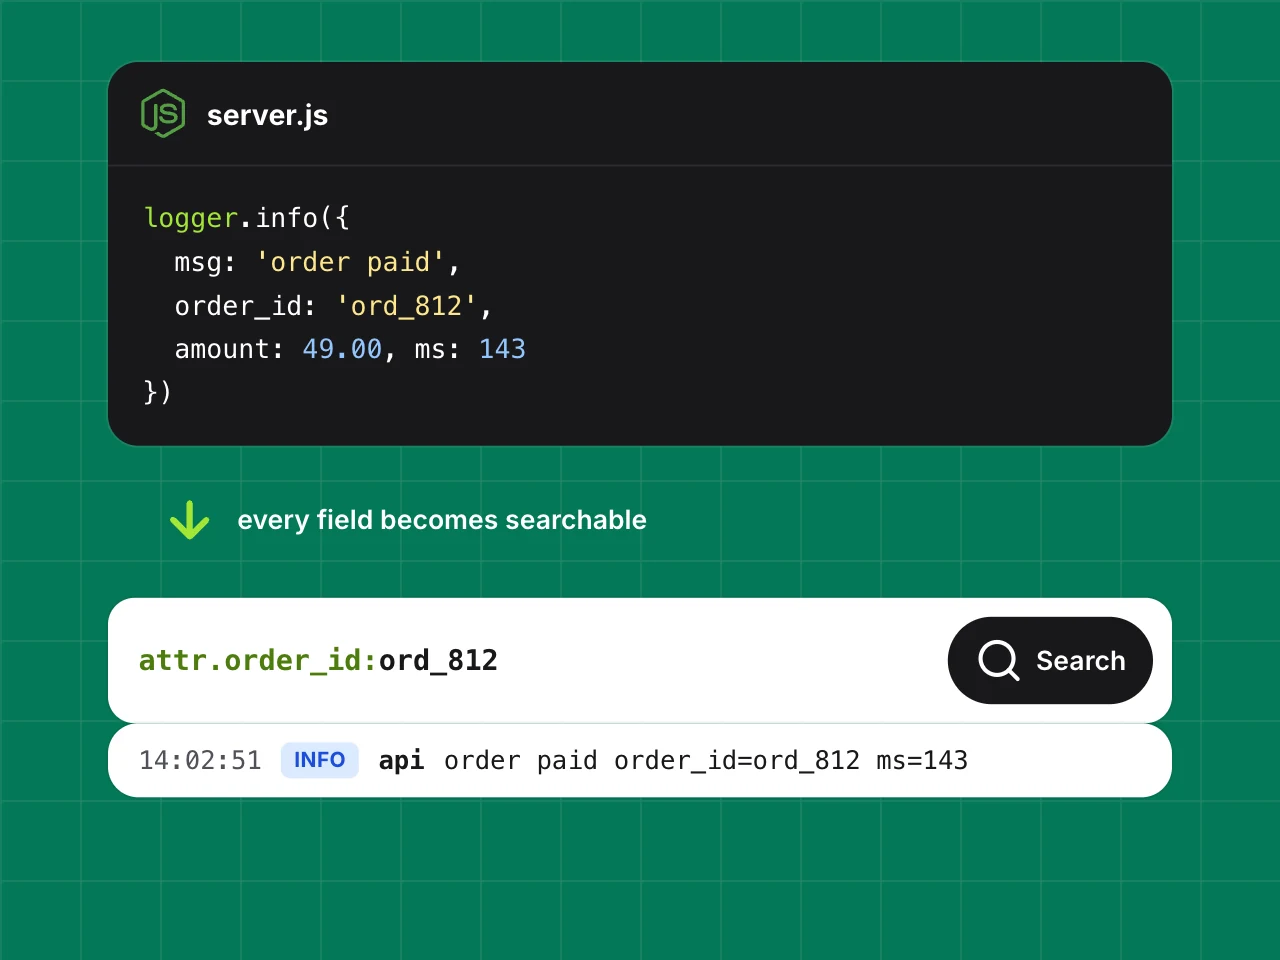
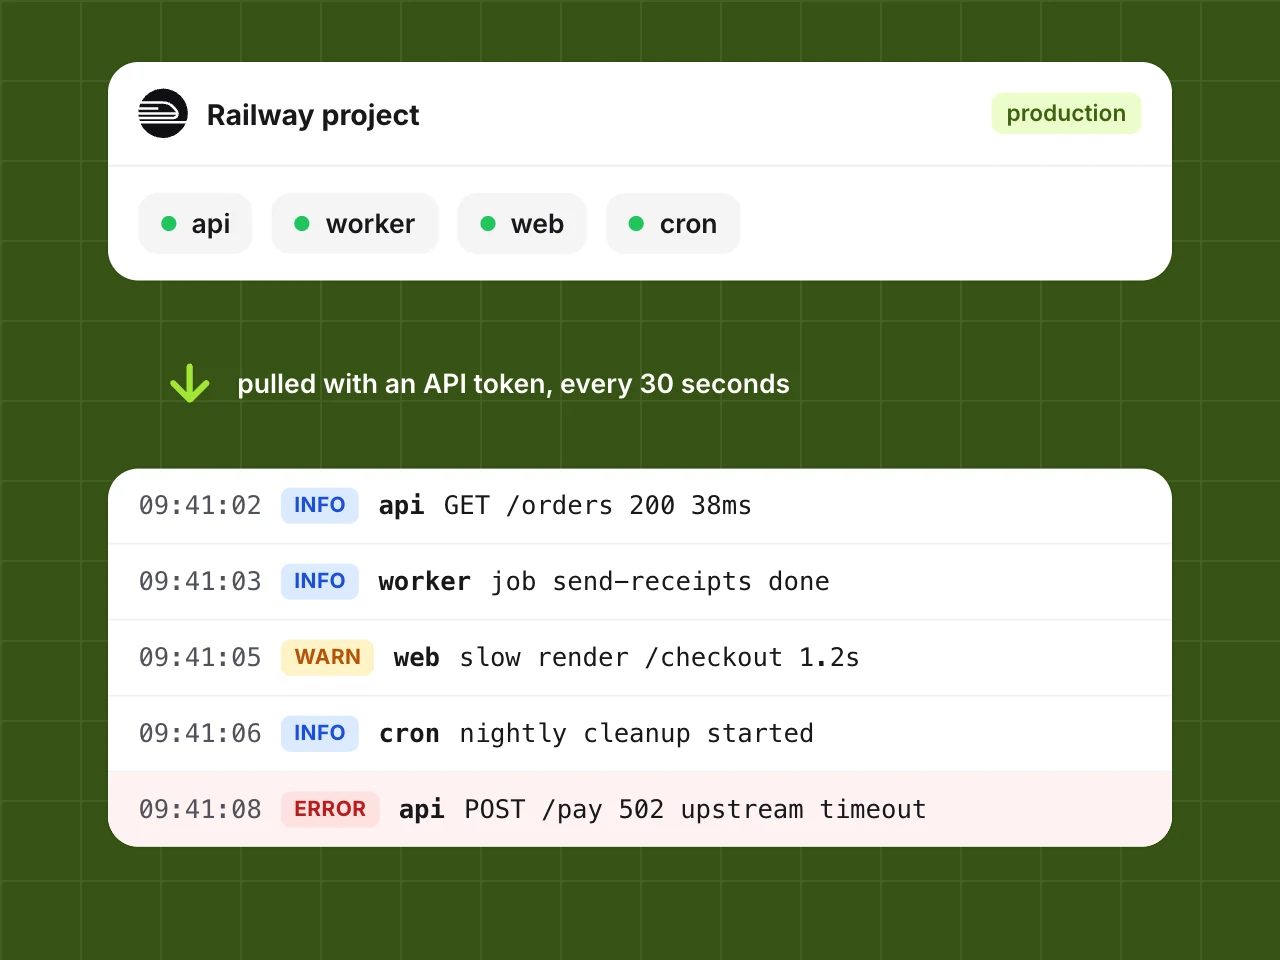
request:req_8f2cIf your services pass the id along and log it, as the structured logging guide describes, this shows the whole path: the request arriving at the edge, the API handling it, the call to the worker, the query that failed and the error that came back. Lines from Vercel, Railway, Render and the HTTP endpoint sit side by side, in time order. On Railway, edge request logs carry Railway's own request id, and your app's JSON fields arrive as attributes, so search attr.request_id: for the id your code logged.
Without request ids, fall back to time: the same second, the same service, the same path. It works, but it is slower and easier to get wrong, which is the best argument for adding them before the next incident.
Step 4: read the lines around it
The error line says what failed. The lines before it usually say why. Click the error and Logyak opens it with the 20 lines before and the 20 after from the same source and service, whatever your search was. That is where the warning sits that you filtered out: the connection pool that was exhausted, the retry that gave up, the config value that was empty after the deploy.
Two habits help here. Search with level:>=warn in the window before the edge: warnings often come minutes before errors. And add -healthcheck, or whatever your health checks log, so they do not crowd the screen.
Step 5: explain it, fix it, check it
If a stack trace or a driver error is hard to read, select the lines and use Explain with AI. It returns the likely cause and the steps to fix it. Before the lines leave Logyak, IP addresses, email addresses and anything that looks like a secret are masked on the server. It uses AI credits, which every plan gets each month. Treat the answer as a second opinion beside the lines you have already read, not as a replacement for them.
When the fix is deployed, keep the status:5xx search open and watch the chart: the red band should stop at the minute the deploy finished. On paid plans, live tail shows new lines as they arrive, which turns that wait into something you can watch. Save the search as a chip so the next time takes one click.
Questions people ask
What is the difference between a 500 and a 502?
A 500 comes from your app: it received the request and failed while handling it. A 502 comes from the proxy in front of your app: it could not get a valid response at all, often because the process crashed, restarted or was not listening yet.
Why do I need a request id if I have timestamps?
On a busy service many requests share the same second, and lines from different services can be slightly out of step. A request id ties every line of one request together exactly, across services, in one search.
Can Logyak tell me when 5xx errors start?
No. Logyak does not send alerts; you find errors by searching, and a saved status:5xx search is one click away on the Logs page. The dashboard also shows errors in the last 24 hours and the most common ones.
How long are the logs kept for a post-mortem?
It depends on the plan: each plan keeps lines for a set number of days, shown on the pricing page. Create a free account to try the routine on your own logs; the Railway guide covers connecting an app there.