How to get logs out of Railway
Railway has no log drains. The three ways to get your logs out anyway: the railway logs CLI, the public GraphQL API, and a tool that pulls them for you.
Sam 5 min read
Updated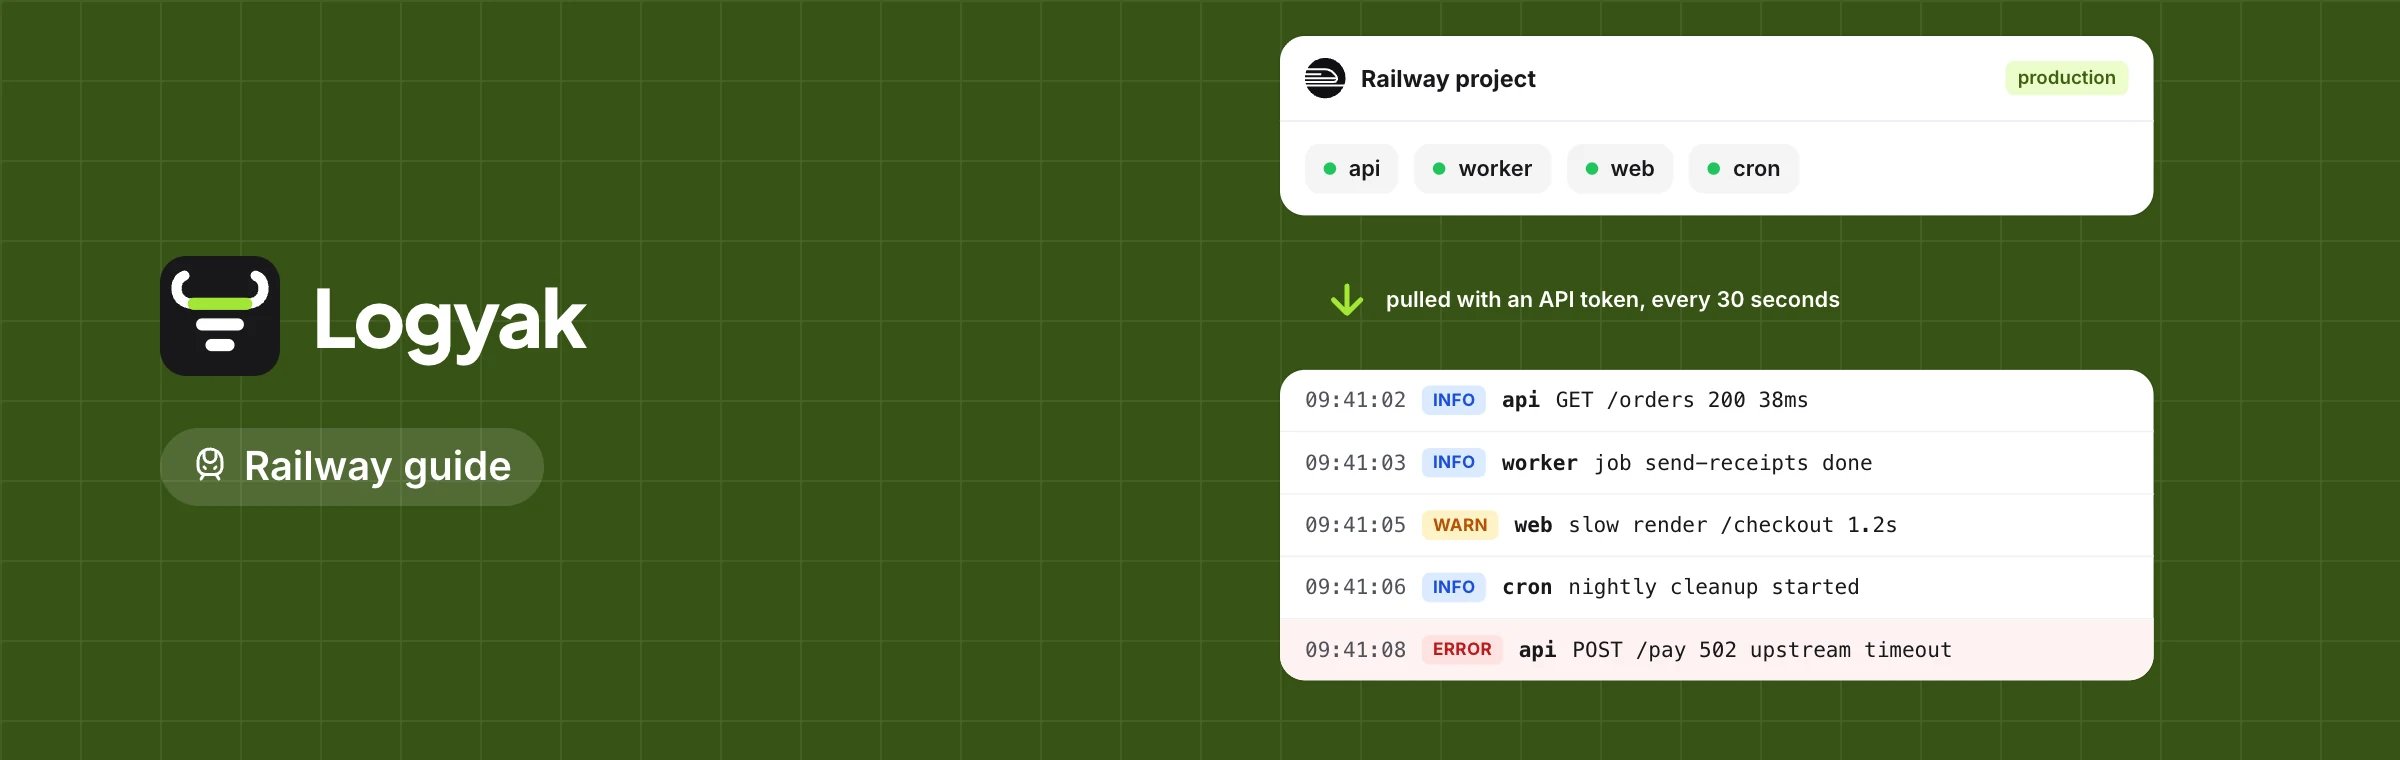
On this page
Railway does not offer log drains, so there is no setting that pushes your logs to another service. To get logs out you have three options: stream them in a terminal with the railway logs command, read them yourself from Railway's public GraphQL API with an API token, or let a log tool pull them from that API on a schedule and keep them searchable. The first is fine for a quick look, the second is a small project of its own, and the third is what most teams settle on once they run more than one service.
The short version. For a quick look, railway logs. For history you can search across services and deploys, a poller on the GraphQL API, written by you or by a tool. Logyak is such a tool: paste a Railway token, pick an environment, and it pulls app and HTTP logs every 30 seconds.
Why there is no drain to set up
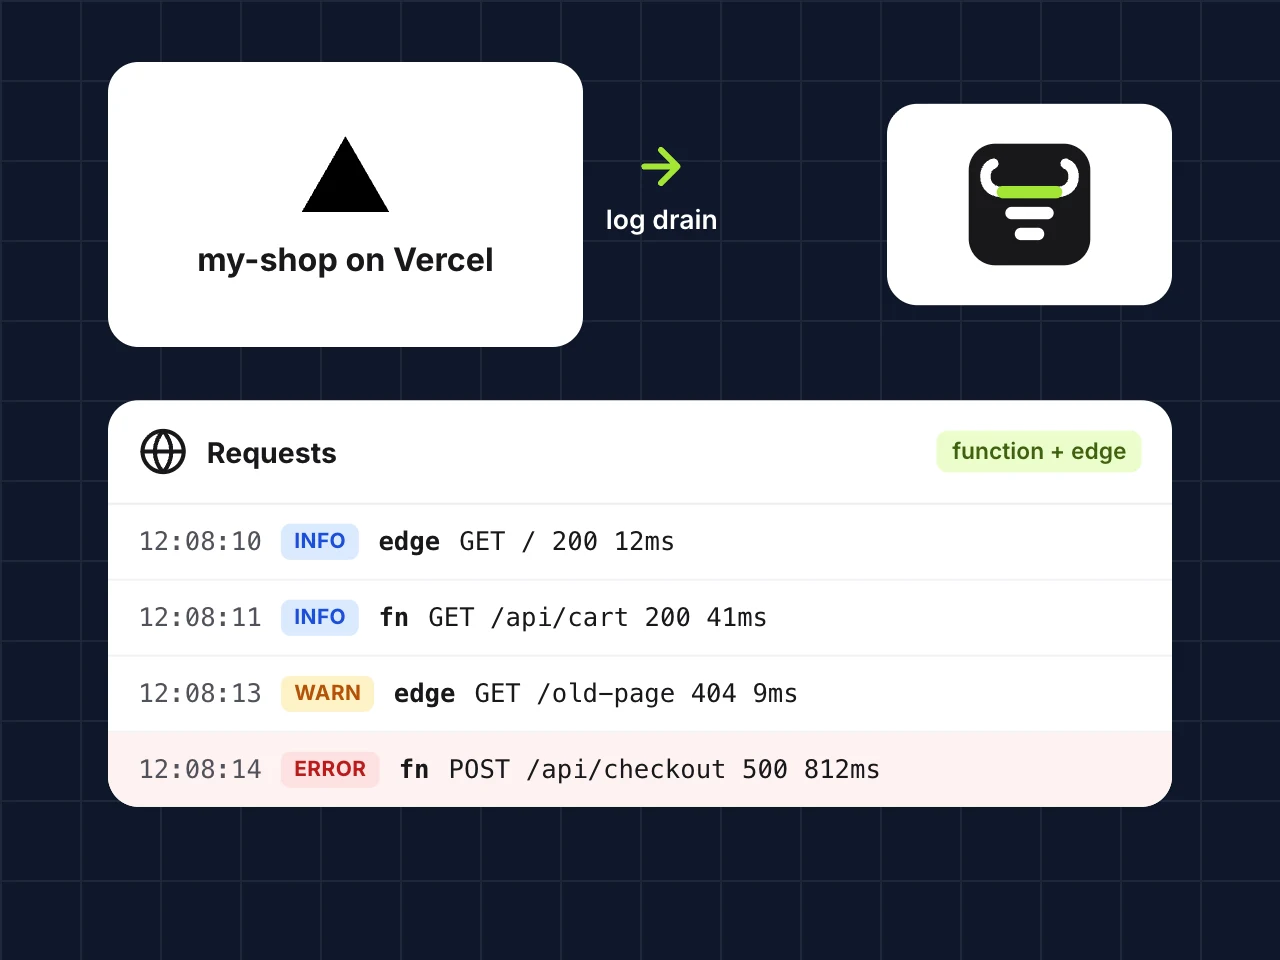
Vercel, Netlify and Render can all send logs to an address you give them. Railway keeps them in its own log explorer instead. That explorer is good for what it does: you can filter by service and deployment, and if your app writes JSON lines, Railway reads the fields and lets you filter on them. What it does not do is send anything elsewhere, and it keeps logs for a limited time that depends on your Railway plan. So the moment you want a search across last week's deploys, a saved query, or one place for the API on Railway and the front end on Vercel, the logs have to be fetched.
Option 1: the railway logs command
The Railway CLI streams the logs of a linked service to your terminal. After railway login and railway link in your project folder:
railway logs            # stream the latest deployment's logs
railway logs --build    # the build logs instead
It is the quickest way to watch a deploy, and you can pipe it into grep or a file. Its limits are the limits of a terminal: one service at a time, only while the command runs, and nothing kept once you close it. Redirecting it to a file on your laptop is a backup of sorts, but it stops when your laptop sleeps.
Option 2: the public GraphQL API
Everything the dashboard shows comes from Railway's public API at https://backboard.railway.com/graphql/v2, and logs are part of it. The queries that matter:
| Query | What it returns |
|---|---|
environmentLogs | The app logs of every service in one environment, in one call |
deploymentLogs | The app logs of a single deployment |
buildLogs | The build output of a deployment |
httpLogs | Requests at Railway's edge for a deployment: method, path, status, duration, request id |
You authenticate with a token made in the Railway dashboard. An account or workspace token goes in an Authorization: Bearer header and can see many projects; a project token goes in a Project-Access-Token header and only sees one environment of one project. For a log reader, the project token is the safer choice: if it leaks, the damage stays in one place.
Writing the poller is where the work is. You keep a cursor per query (the time of the last line you stored), ask for lines after it, and handle lines that share a timestamp so they are neither lost nor stored twice. HTTP logs are per deployment, so you look up the current deployments of each service first. Then there is the rate limit, retries, somewhere to store the lines, and a search on top. It is a weekend for the first version and a steady trickle of fixes after.
Option 3: let a tool pull them
This is what Logyak does for Railway, so here is exactly how it works:
- Make a token in Railway. A project token for the environment you care about is enough.
- Add a Railway source in Logyak and paste it. Logyak asks Railway which projects and environments the token can see, and you pick one. The token is stored encrypted and never shown again.
- Choose whether to include HTTP logs. With them on, every request at Railway's edge arrives as a line with its method, path, status and duration, beside your app's own output.
- Wait about 30 seconds. Logyak polls
environmentLogsandhttpLogsevery 30 seconds, so lines show up a little behind real time, each tagged with the Railway service it came from.
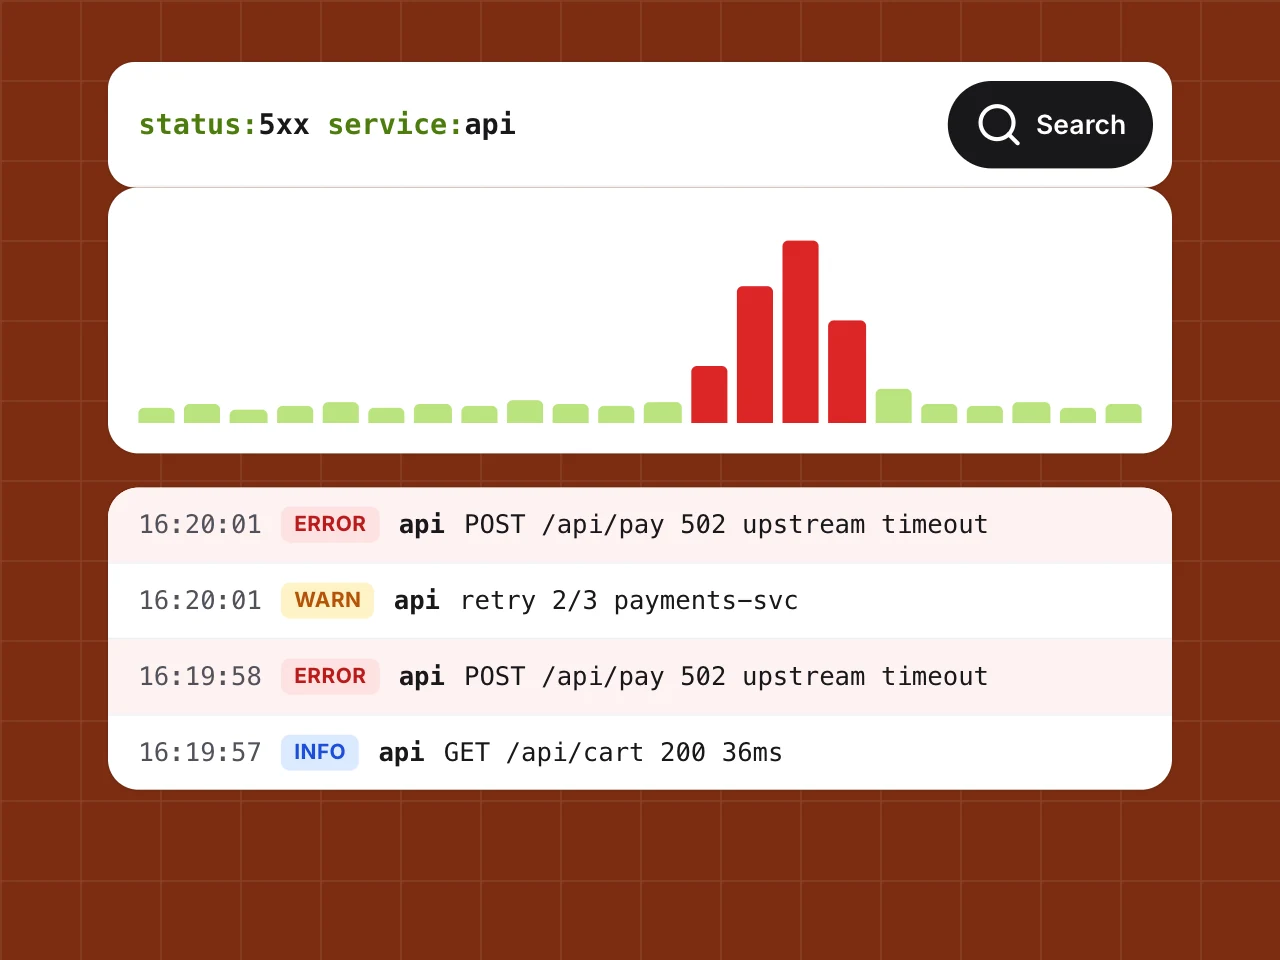
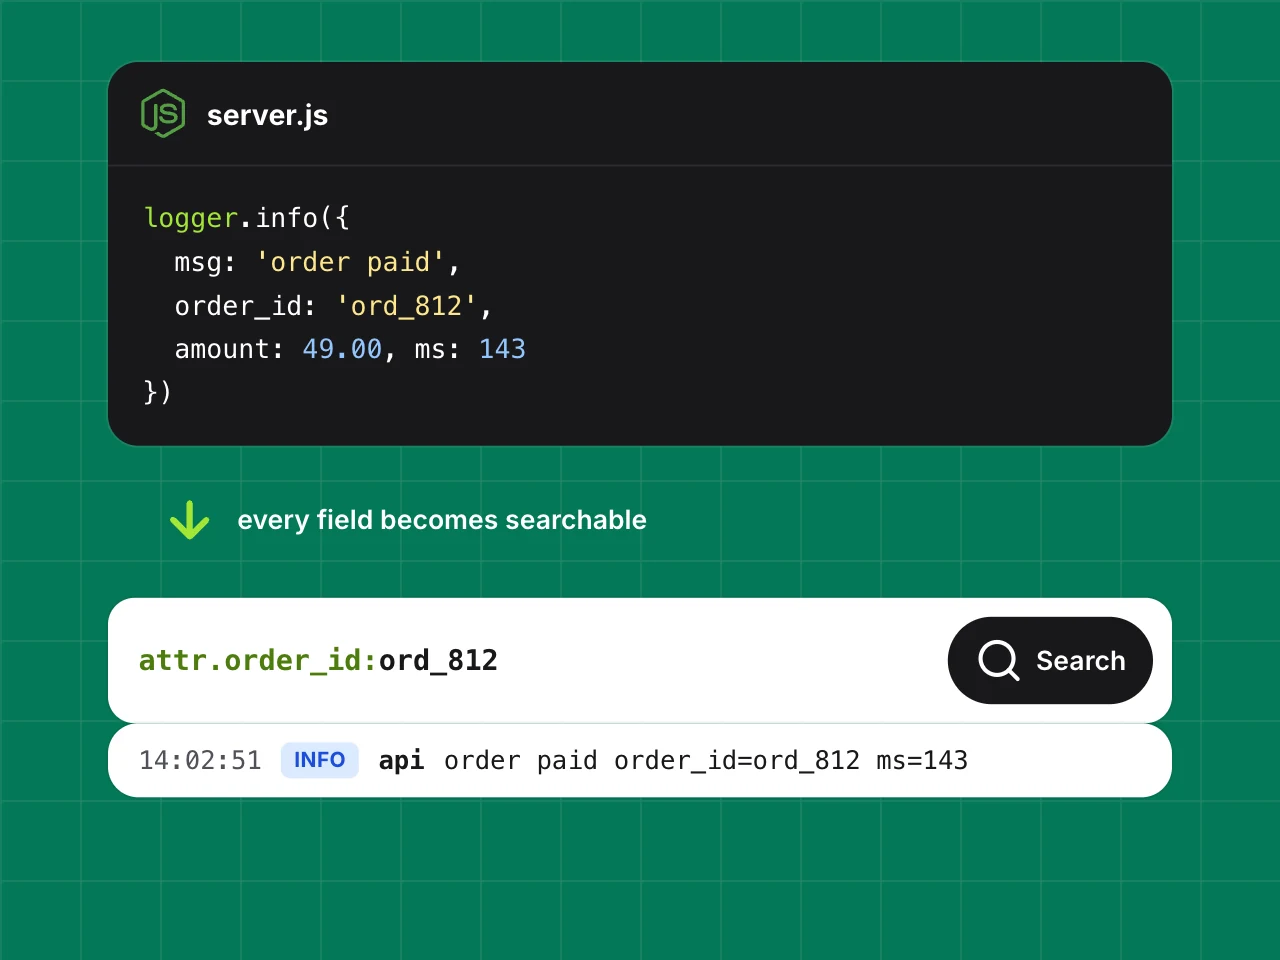
Once they are in, you search them with the same language as every other source: service:api level:>=warn, status:5xx path:/api/*, or a phrase in quotes. If your app writes JSON, the fields Railway reads become attributes you can search with attr., which the guide to structured logging in Node.js covers in detail.
What to log so Railway logs are useful anywhere
- One line per event, as JSON. Railway reads JSON lines into fields, and so does every log tool. A multi-line stack trace printed as plain text arrives as several unrelated lines.
- A level on every line. Railway files everything written to stderr as an error, so a library that prints warnings to stderr looks alarming. A
levelfield settles it. - A request id. Railway's HTTP logs carry their own request id; log yours on the app side too, and one search finds the request and everything your code said about it. The guide on finding the cause of a 5xx shows why that matters.
- No secrets. Logs travel and get copied. Keep tokens, passwords and full card numbers out of them.
Questions people ask
Does Railway support log drains?
No. Railway keeps logs in its own log explorer and does not push them to other services. To keep them elsewhere you read them from the CLI or from the public GraphQL API, or use a tool that polls that API for you.
Which Railway token should I give a log tool?
A project token where you can. It only sees one environment of one project, so it is the least a log reader needs. An account or workspace token works too, but it can see every project it has access to.
How far behind real time are the logs in Logyak?
Up to about 30 seconds, because Logyak asks Railway for new lines every 30 seconds. Each line keeps the time Railway recorded, so the order and the timestamps are exact even when they arrive a little later.
What does it cost to keep Railway logs in Logyak?
Every plan, the free one included, has a monthly allowance of log megabytes shared across all your sources and a number of days lines are kept. The pricing page has the numbers, and you can create a free account to try it on one project.