Structured logging in Node.js you can search
Write Node.js logs as JSON lines with a level, a service and a request id, using console.log or pino, so any log tool can filter them in one query.
Sam 5 min read
Updated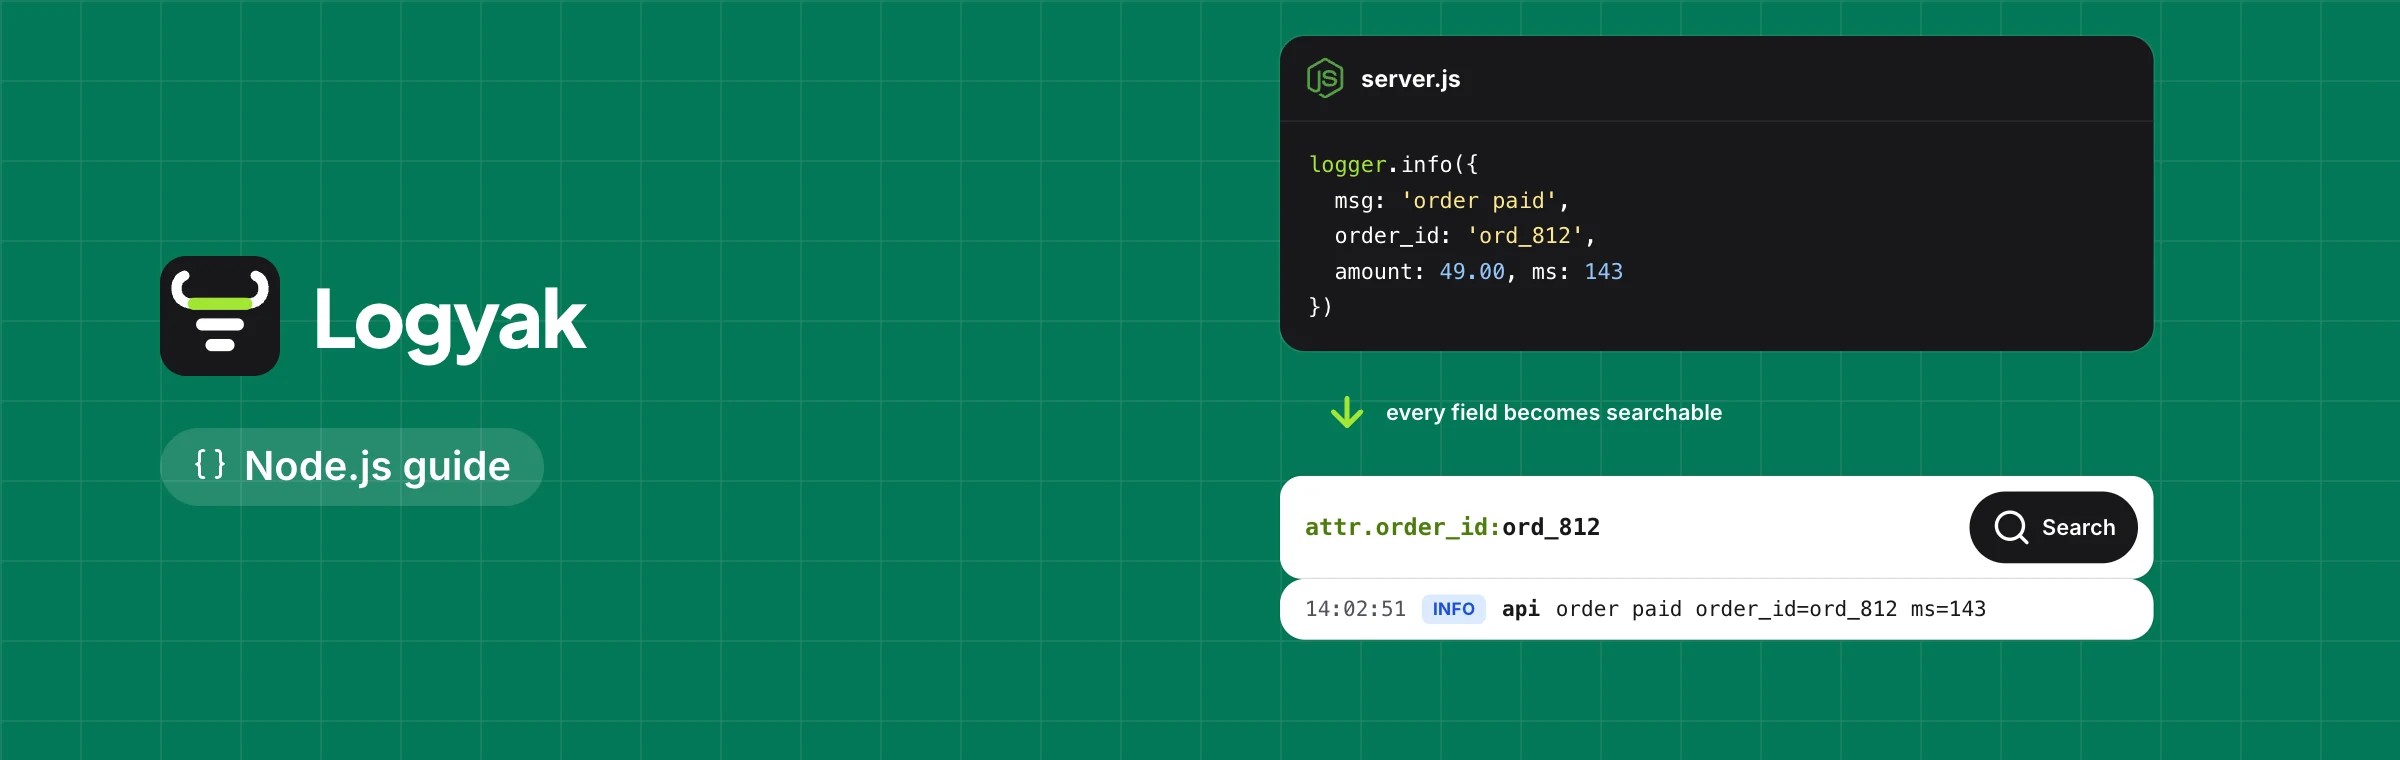
On this page
Structured logging in Node.js means writing every log line as one JSON object instead of a sentence, with the same few fields on every line: a level, a message, the service that wrote it, and the id of the request it belongs to. You can do it with nothing more than console.log(JSON.stringify(...)), or with a logger such as pino that does it for you and faster. Either way the result is the same: a log tool can filter on any field, so "errors from the API for this request" is one query instead of a scroll through text.
The short version. One JSON object per line. Always level, msg or message, service and request_id. Put the details in their own fields, never inside the message string. Never log secrets.
Why plain text logs are hard to search
Compare two lines that say the same thing:
Order 1042 failed for user 77 after 3012ms: payment timeout

{"level":"error","service":"api","request_id":"req_8f2c","msg":"order failed","order_id":1042,"user_id":77,"duration_ms":3012,"reason":"payment timeout"}
The first is pleasant to read and painful to query. To find every slow order you need a regular expression, and it breaks the day someone rewords the sentence. The second is a record. A log tool can ask for duration_ms above 1000, every line with user_id 77, or only errors from the API, without guessing at wording. The message stays short and constant, which also makes it easy to count how often each thing happens.
The four fields every line needs
- level:
debug,info,warn,errororfatal. It is what you filter on first, and it lets you hide the noise without deleting it. - message (
msgin pino): a short, fixed phrase such as "order failed". Variable values go in their own fields. - service: which program wrote it, such as
api,workerorweb. With more than one service it is the difference between a search and a guess. - request_id: one id per incoming request, on every line that request causes, in every service it touches. It is the field that turns a pile of lines into a story.
A timestamp is the fifth, but loggers and platforms add one for you. Add whatever else helps: user_id, order_id, duration_ms, status.
With console.log only
No dependency needed. A tiny helper keeps every line the same shape:
const SERVICE = process.env.SERVICE_NAME || 'api'

function log(level, msg, fields = {}) {
  const line = { level, service: SERVICE, msg, ...fields, time: new Date().toISOString() }
  const out = level === 'error' || level === 'fatal' ? console.error : console.log
  out(JSON.stringify(line))
}

log('info', 'order created', { request_id: req.id, order_id: 1042 })
log('error', 'order failed', { request_id: req.id, order_id: 1042, reason: err.message })
Two rules make it hold up. Never print an object without JSON.stringify, or Node prints a multi-line inspection that arrives as several lines. And log an error's message and stack as fields, not the error object itself, which stringifies to {}.
With pino
pino writes JSON lines by default and is built to be fast. A child logger carries the request id for you:
import pino from 'pino'
import { randomUUID } from 'node:crypto'

const logger = pino({ name: 'api' })

app.use((req, res, next) => {
  req.id = req.headers['x-request-id'] || randomUUID()
  res.setHeader('x-request-id', req.id)
  req.log = logger.child({ request_id: req.id })
  next()
})

app.post('/orders', async (req, res) => {
  req.log.info({ order_id: 1042 }, 'order created')
})
pino writes the level as a number (30 is info, 40 warn, 50 error), the time as milliseconds, name for the service and msg for the message. Logyak reads all of these as they are, so you do not need to reformat anything. Reading x-request-id from the incoming request, and sending it on to the services you call, is what lets one id follow a request from the front end to the worker.
Searching the result in Logyak
Lines that reach Logyak, through the HTTP endpoint, the Node.js logger or a platform's drain, are split into fields: level, service, host, status, path, duration and request id, with everything else kept as attributes. Then the search box does the work:
| Query | Finds |
|---|---|
level:>=warn service:api | Warnings and errors from the API only |
request:req_8f2c | Every line of one request, from every service |
attr.user_id:77 | Everything that happened to one user |
duration:>1000 path:/api/* | Slow API requests |
"payment timeout" -healthcheck | A phrase, without the health check noise |
Save the searches you run often and they sit as chips above the box. When one of them turns up a run of 500s, the guide to finding the cause of a 5xx picks up from there. On Vercel the drain adds the request fields itself, as the drains guide shows.
Questions people ask
Is console.log fast enough for production logging?
For most apps, yes. Writing to stdout is cheap compared with a database call. At very high volume a dedicated logger such as pino is faster, because it avoids extra work per line and can write asynchronously.
Should I log a stack trace as one field or many lines?
One field. Put the stack in a stack field of a single JSON line. Printed as plain text it arrives as many separate lines, each without the level or request id, and a search for the request misses most of it.
What should never go in a log line?
Passwords, tokens, API keys, full card numbers and session cookies. Logs are copied to more places than a database. When you send lines to Explain with AI, Logyak masks IP addresses, email addresses and anything that looks like a secret, but the safest secret is one you never logged.
Do I need the Node.js logger to send logs to Logyak?
No. Any app can POST JSON, NDJSON or plain text to the HTTP endpoint with its source token, and platforms with drains send lines themselves. The logger is a convenience. Create a free account to get a token, and see the pricing page for limits.